A spreadsheet such as Google Sheets or Microsoft Excel, is a very useful tool for doing calculations and making complex tables. You can type in your own custom calculations or use the built-in formulas.
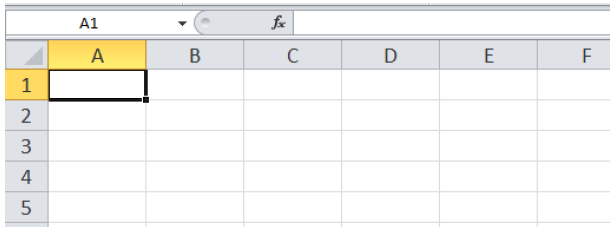
The rectangles within a spreadsheet are called cells, and they can be referenced by their column letter and row number. The first cell in the upper left side highlighted below is A1. If we wanted to talk about the third column and the fifth row, that cell would be C5.
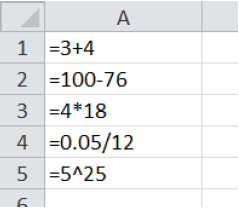
To do a calculation on a spreadsheet, type an equal sign before the operation. This lets the program know that you want it to calculate the result. When you press enter, you will see the result.
Note that the asterisk (*) is used for multiplication. Spreadsheets don’t recognize parentheses as indicators of multiplication like calculators do, so even if you have parentheses for the order of operations, the asterisk is also needed.
You can make more complicated mathematical expressions using parentheses and other operations. To edit a cell click on the editing box at the top, or double click on the cell to edit it directly.
One of the powerful things about spreadsheets is using a cell reference, such as C5 in a calculation. When you use a cell reference, the values will automatically update if any of the referenced values change.
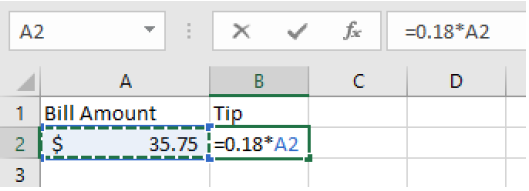
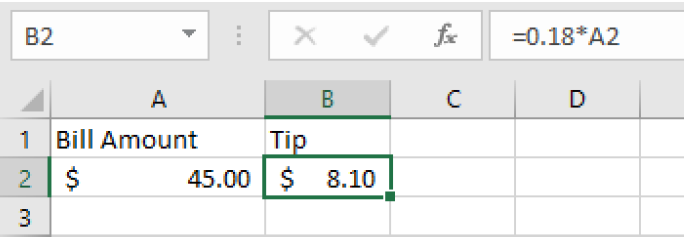
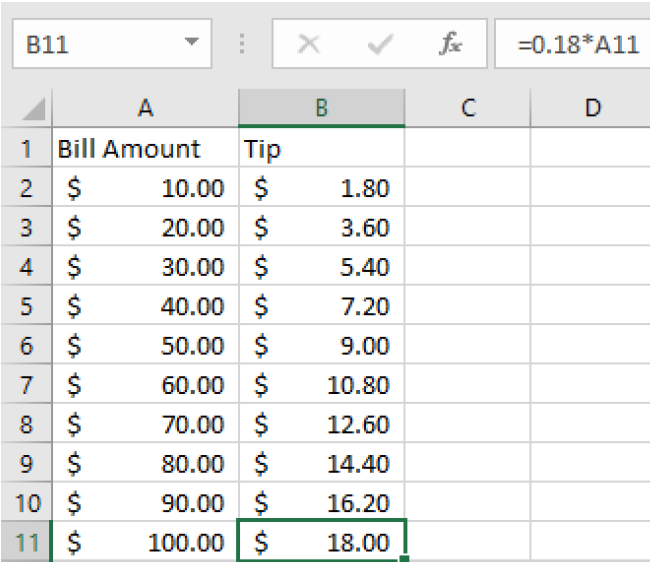
Let’s make a spreadsheet for the percentage tip example above. We calculated an 18% tip on a bill of $35.75. We might want to tip 18% in general, but our bill will change values. We labeled the first column Bill Amount and the second column Tip. The amount of $35.75 is entered in cell A2. Then when we write our formula in B2, we want to calculate 18% of A2. That way if the number in A2 changes, our tip will automatically update.
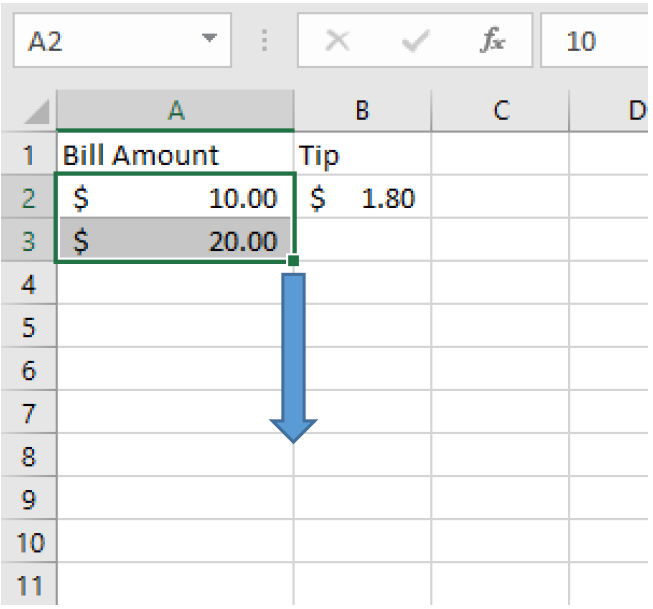
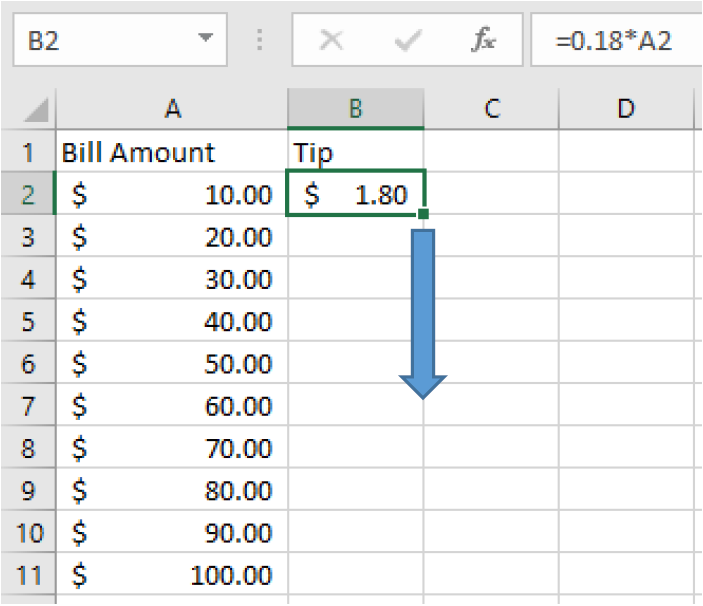
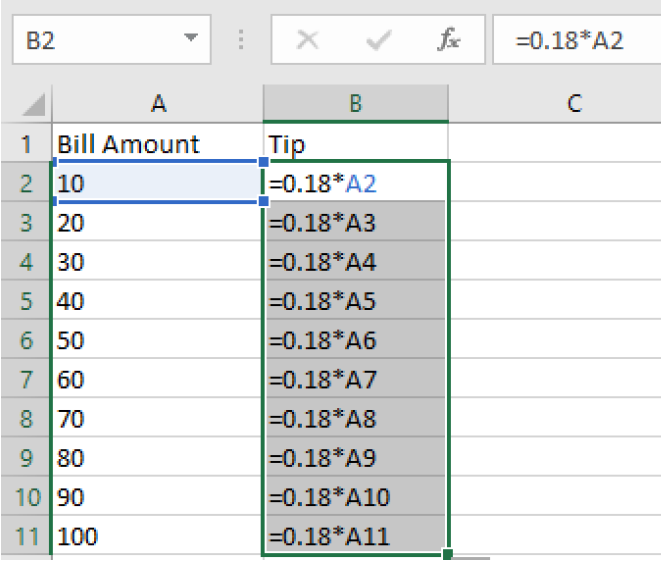
The fill-down feature is very useful for making tables. This allows us to copy values or formulas to save time. Let’s make a tipping reference table with values from $10, to$100, in increments of $10. First, we will enter two values in column A to establish the pattern. Then select those two cells and you will see a small square in the lower right corner. Drag that square down until you get to $100.
Spreadsheets have many useful built-in formulas. We will introduce some of the financial formulas in this chapter. Here are some of the formulas we will use:
=FV to calculate the future values of an investment
In Column A use the fill down feature to build a spreadsheet starting with $5 and ending at $125, in increments of $5. In Column B write a formula with a cell reference to calculate a 15.5% tip on the amount in Column A. Use the fill down feature to complete your table.
Imagine that at the start of a certain month, you will make an opening deposit of $500 into a savings account, and you will then leave the account alone (meaning you will make no further deposits or withdrawals). Also, for this account: Every month after the opening deposit, the amount in the account will grow to be 101% of its previous month’s balance.
Use a spreadsheet to enter 500 in cell A1. Using a formula and a cell-reference: Compute in cell A2, the amount in the account after one month has passed. Then using the fill down feature, continue the pattern for another eleven full months (you should end at cell A13). Format all the cells to show dollar signs. What is the amount in the account after one year?
Now continue the pattern in column A of your spreadsheet to extend for a second full year (you should end at cell A25). What is the amount in the account after two years?
What overall percentage growth occurred in the account between the end of year one, and the end of year two? (Compute using a formula and cell references)
(Challenge) The annual percentage growth that you found in part (d) for the second year, should be identical to the annual percentage growth that you found in part (c) for the first year. Can you mathematically explain why this is true? Do you think this pattern of identical overall annual percentage growth would continue, if you extend the pattern for even more years?
Imagine that at the start of a certain year, you will deposit $1000.00 into a savings account, and then you will leave the account alone. Each year after the opening deposit, the amount in the account will grow to be 103% of its previous year’s balance.
After two years, the account balance will have experienced two growth amounts of 103%. You can find this account balance amount here, with the spreadsheet computation = 1000 * (103%) * (103%). Perform this computation in a spreadsheet and write the balance that you find.
Now enter the spreadsheet computation = 1000 * (103%)^2. Notice that the result here, which involves using a power, gives the same answer as you found in part (a). Comparing the two spreadsheet computations: Explain why they give the same result.
Using the pattern in part (b) above, and carefully choosing the power: Compute the balance that will be in the account fifteen full years after the account was originally opened. (Round to the nearest cent)
(Challenge) Make a spreadsheet that shows the account balance each individual year for 30 years. From the date of the opening deposit: What minimum number of full years will you have to wait, until the balance finally exceeds twice its opening deposit amount? (Use cell references, the fill down feature, and dollar formatting)
(Challenge) Imagine the opening balance of the account was $5000.00 instead of $1000.00 (and everything else about the account stays the same). Make a similar spreadsheet as you did in part (d), and using this spreadsheet, find the minimum number of full years you will have to wait this time, until the balance finally exceeds twice its opening deposit amount. How does this answer compare with your answer in part (d)? Do you think your answer would be the same here, for any positive opening balance you may choose for the account?