Determine whether two characteristics are independent
Figure4.1.1.Alternative Video Lesson
When we looked at categorical data in the previous chapter, it was related to a single variable, or characteristic of interest, such as favorite movie or car color. To illustrate the data, we made a frequency table and used it to create a pie chart or bar chart. But what if we want to illustrate the relationship between two categorical variables? To do this, we can use a contingency table.
Subsection4.1.1Contingency Tables
A contingency table summarizes all the possible combinations for two categorical variables. Each value in the table represents the number of times a particular combination of outcomes occurs. For example, suppose we randomly select 250 households from the greater Portland area and ask whether they have a cat and whether they have a dog. In this case, “have a cat” and “have a dog” are the two variables, and each variable has two categories: Yes and No. To create the contingency table, we make columns for the categories of one variable, and rows for the categories of the other variable. We also add a row and column for the subtotals of each category. Each cell of the resulting table contains the number of outcomes having the characteristics of the intersecting row and column categories. For our dog and cat example, the table would look like this:
Dog
No Dog
Total
Cat
Yes Cat and Yes Dog
Yes Cat and No Dog
Yes Cat Total
No Cat
No Cat and Yes Dog
No Cat and No Dog
No Cat Total
Total
Yes Dog Total
No Dog Total
Grand total
Suppose that of the 250 households surveyed, 180 said they have a cat, 95 said they have a dog, and 52 said they have both a cat and a dog. We can use this information to fill in the cells of the table.
Dog
No Dog
Total
Cat
52
180
No Cat
Total
95
250
The first cell we can fill in is the grand total, which is the total number of subjects in the study. In this case, there are 250 households participating in the survey. The next two cells we can fill in are the total number of households that have a cat, 180, and the total number of households that have a dog, 95. The final cell we can fill in from the given information is the intersection of the having a dog column and a having a cat row, which is 52 households.
Since each row and column must sum to their totals, we can use subtraction to find the missing numbers as shown below.
Dog
No Dog
Total
Cat
52
\(180-52=128\)
180
No Cat
\(95-52=43\)
\(155-128=27\) or \(70-43=27\)
\(250-180=70\)
Total
95
\(250-95=155\)
250
Now that we have our contingency table completed, notice that the numbers in the central four cells add to the grand total as shown in the table on the left. The total row and the total column also add to the grand total as shown in the right table.
Dog
No Dog
Total
Cat
52
128
180
No Cat
43
27
70
Total
95
155
250
Dog
No Dog
Total
Cat
52
128
180
No Cat
43
27
70
Total
95
155
250
Subsection4.1.2Contingency Tables and Venn Diagrams
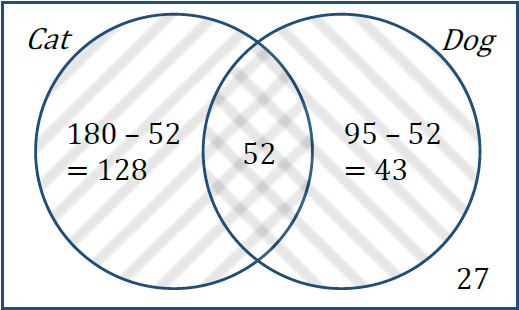
If the subtractions we just did seem familiar, they should! This is very similar to what we did for reporting data with a Venn diagram. The Venn diagram for this data is shown below. We also subtracted the intersection from the total of the cat and dog owners to find numbers in the crescent regions.
Notice that the numbers in the four regions of the Venn diagram are the same as the four cells in the center of the contingency table and add to the grand total.
Subsection4.1.3“And” Statements
Now we can use the contingency table or the Venn diagram to determine the percentage of households that meet certain conditions. For instance, what percent of those surveyed own a cat and do not own a dog? In the Venn diagram, this is 128 households in the cat only region.
In the contingency table we see the 128 households at the intersection of the row of households who own a cat and the column of households who do not own a dog. As a percentage, the total number of households surveyed, is \(\frac{128}{250}=0.512\) or 51.2% that have a cat and no dog.
Dog
No Dog
Total
Cat
52
128
180
No Cat
43
27
70
Total
95
155
250
Subsection4.1.4“Or” Statements
How about the percentage of households surveyed that have a cat or a dog? We know from Venn diagrams that the inclusive or includes the number of households who own a cat only, a dog only, and both a cat and a dog, or \(128+52+43=223\) households. As a percentage of the total surveyed, we get \(\frac{223}{250}=0.892\) or 89.2% of households in the sample have a dog or a cat (or both).
We can get the same answer from the contingency table. by adding the cells for households who have a cat and not a dog, a dog and not a cat, and the households that have both a cat and a dog. This also gives us 223 households.
There is another way to calculate an or statements from a contingency table. We could add the row and column totals for having a cat and having a dog, but then we have counted the 52 households in the intersection twice. We can subtract that number to get \(180+95-52=223\) households with a dog or a cat, which we know is 89.2% of those surveyed.
Dog
No Dog
Total
Cat
52
128
180
No Cat
43
27
70
Total
95
155
250
Subsection4.1.5Conditional Statements
Another question we can answer using a contingency table is what percentage of dog owning households also own a cat? In this case the group that we are interested in isn’t every household surveyed (the grand total), but just those households that own a dog.
Dog
No Dog
Total
Cat
52
128
180
No Cat
43
27
70
Total
95
155
250
We call this a conditional statement because we are only considering the households with a certain condition. If we focus on the column representing the households that own a dog, we see that there is a total of 95 households with a dog, and that 52 of those 95 households also have a cat. Therefore, \(\frac{52}{95} \approx 0.547\) or approximately 54.7% of the households with a dog also have a cat. Another way to phrase this conditional statement is, “What percent of households have a cat given they have a dog.” You will see the word given quite a bit in this chapter and that makes the denominator change. It is also possible to find this conditional percentage using the Venn diagram by taking the number in the intersection and dividing it by the total in the whole dog circle.
Subsection4.1.6Contingency Tables with More Than Two Categories
When there are only two categories for each variable, like yes/no questions, Venn diagrams and contingency tables provide basically the same information and can be used interchangeably. A Venn diagram works well for yes/no variables since a subject is either inside the circle (has the characteristic) or outside the circle (does not have the characteristic). If we have more than two possibilities for any of the variables, though, we cannot use a Venn diagram. We can use a contingency table, though. Here is an example where one variable has four categories and the other has three categories.
Example4.1.2.
910 randomly sampled registered voters from Tampa, FL were asked if they thought workers who have illegally entered the US should (i) be allowed to keep their jobs and apply for US citizenship, (ii) be allowed to keep their jobs as temporary guest workers but not be allowed to apply for US citizenship, or (iii) lose their jobs and have to leave the country. Not sure was also an option (iv). The results of the survey by political ideology are shown below 1
. Use the contingency table to answer the questions.
Conservative
Moderate
Liberal
Total
(i) Apply for citizenship
57
120
101
278
(ii) Guest worker
121
113
28
262
(iii) Leave the country
179
126
45
350
(iv) Not sure
15
4
1
20
Total
372
363
175
910
What percent of the sampled Tampa, FL voters identified themselves as conservatives?
What percent of the sampled voters are in favor of the citizenship option?
What percent of the sampled voters identify themselves as conservatives and are in favor of the citizenship option?
What percent of the sampled voters identify themselves as liberal or are in favor of the leaving the country option?
What percent of the sampled voters who identify as conservatives are also in favor of the citizenship option? What percent of moderate and liberal voters share this view?
Solution.
To answer this question, we find the conservative column and look to the bottom cell for the total number of conservative voters and divide that by the total number of voters surveyed. This gives us \(\frac{372}{910}\approx 0.409\) or approximately 41% of the Tampa, FL voters who identify as conservative.
For this question we find the apply for citizenship row, look across to find the total, and divide this by the total number of voters surveyed. We get \(\frac{278}{910} \approx 0.305\) or approximately 31% of these voters are in favor of the citizenship option.
For this question we are looking for the cell that is the intersection of those who identify as conservative and those who are in favor of the citizen option. This cell has 57 voters, so we divide that by the total number of voters. This gives us or \(\frac{57}{910} \approx 0.063\) or approximately 6.3% of these voters identify as conservatives and are in favor of the citizenship option.
The or in this question is inclusive, so we need to determine the number of voters who identify as liberal, who are in favor of the leaving the country option, or both.
Conservative
Moderate
Liberal
Total
(i) Apply for citizenship
57
120
101
278
(ii) Guest worker
121
113
28
262
(iii) Leave the country
179
126
45
350
(iv) Not sure
15
4
1
20
Total
372
363
175
910
In terms of the individual cells, the number of voters who have the specified characteristics is the sum \(179+126+101+28+45+1=480\text{,}\) which we can divide by the total number of voters surveyed to get the percent. So, we have \(\frac{480}{910} \approx 0.527\) or approximately 53% of the voters identify as liberal or are in favor of the leave the country option.
Another way to calculate this is to add the total number who identify as liberal (175 voters) and the total number who are in favor of the leave the country option (350 voters), then subtract the double counted cell (45 voters) who are liberal and in favor of the leave the country option: \(175+350-45=480\)
As we saw before, these are conditional statements. For the first part of this question, we want to focus just on those voters who identify as conservatives, and from among that group determine the percent in favor of the citizenship option. We calculate that \(\frac{57}{372} \approx 0.153\) or approximately 15% of conservative voters are in favor of the citizenship option.
For the second part, we want to focus on just those voters who identify as moderate, and from among that group determine the percent in favor of the citizenship option. Then we have \(\frac{120}{363} \approx 0.33\) or approximately 33% of moderate voters are in favor of the citizen option.
Finally, we want to focus on just those voters who identify as liberal, and from among that group determine the percent in favor of the citizenship option. We calculate \(\frac{101}{175} \approx 0.58\) or approximately 58% of liberal voters are in favor of the citizenship option. Looking at these three percentages, it is clear that support of the citizenship option depends on political ideology. If support of the citizenship option were the same across political ideologies, then we would say that favoring the citizenship option and political ideology were independent of each other.
Subsection4.1.7Empirical Probability
If our sample is representative of the population, then we can also interpret a percentage we calculate from a contingency table as a probability, or the likelihood that something will happen. Since a contingency table is constructed from data collected through sampling or an experiment, we call it an empirical or experimental probability. This is different from a theoretical probability which we will look at in the next section.
Subsection4.1.8Finding Empirical Probabilities with a Contingency Table
Suppose that 60% of students in our class have a summer birthday (June, July, or August). Now suppose everyone’s name and birth month are written on slips of paper and thrown into a bag. If we pull a slip of paper out of the bag at random, what is the probability that the selected student has a summer birthday? If you think there should be a 60% chance, you are right! The relative frequency of the characteristic of interest will be equal to its empirical probability. To write this as a probability statement, it would look like
Probability is a function named P, and the function is applied to what follows in the parentheses. Let’s look at another example where we write probability statements and find empirical probabilities.
Example4.1.3.
A survey of licensed drivers asked whether they had received a speeding ticket in the last year and whether their car is red. The results of the survey are shown in the contingency table to the right.
Speeding Ticket
No Speeding Ticket
Total
Red Car
15
135
150
Not Red Car
45
470
515
Total
60
605
665
Find the probability that a randomly selected survey participant:
has a red car.
has had a speeding ticket in the last year.
has a red car and has not had a speeding ticket in the last year.
has a red car or has had a speeding ticket in the last year.
has had a speeding ticket in the last year given they have a red car.
who has received a speeding ticket in the last year also has a red car.
What do the answers to b and e suggest about the relationship between owning a red car and getting a speeding ticket?
Solution.
Speeding Ticket
No Speeding Ticket
Total
Red Car
15
135
150
Not Red Car
45
470
515
Total
60
605
665
To find \(P(\text{red car})\text{,}\) we divide the number of participants who own a red car by the total number of people surveyed:\(P(\text{red car})=\frac{150}{665} \approx 0.226\) or 22.6%.
Speeding Ticket
No Speeding Ticket
Total
Red Car
15
135
150
Not Red Car
45
470
515
Total
60
605
665
\(P(\text{speeding ticket})\text{,}\) we divide the number of participants who got a speeding ticket in the last year by the total number of people surveyed: \(P(\text{speeding ticket})=\frac{60}{665} \approx 0.09\) or 9%.
Speeding Ticket
No Speeding Ticket
Total
Red Car
15
135
150
Not Red Car
45
470
515
Total
60
605
665
To find \(P(\text{red and no ticket})\) , we find the intersection of the red car category and the no ticket category and divide by the total number of participants: \(P(\text{red and no ticket}) =\frac{135}{665} \approx 0.203\) or 20.3%
Speeding Ticket
No Speeding Ticket
Total
Red Car
15
135
150
Not Red Car
45
470
515
Total
60
605
665
To find \(P(\text{red or ticket})\text{,}\) we need to add those who drive a red car and did not have a speeding ticket (just red), those who had a speeding ticket and do not drive a red car (just ticket) and those who drive a red car and had a speeding ticket (both), and divide by the total number of participants:
\begin{gather*}
P(\text{red and no ticket})=\frac{135+45+15}{665}=\frac{195}{665} \approx 0.293\text{ or } 29.3\%
\end{gather*}
Recall from our earlier discussion that we could also calculate the or probability as:
\begin{align*}
P(\text{red and no ticket})\amp= P(\text{red})+ P(\text{speeding ticket}) - P(\text{red and speeding ticket})\\
\amp=\frac{150}{665}+\frac{60}{665}-\frac{15}{665}\\
\amp=\frac{195}{665}
\end{align*}
which gives us the same answer as counting the individual cells.
Speeding Ticket
No Speeding Ticket
Total
Red Car
15
135
150
Not Red Car
45
470
515
Total
60
605
665
The probability \(P(\text{speeding ticket given red car})\) is a conditional probability as we have seen before since it is conditional on the given characteristic occurring. In this problem, the given characteristic is owning a red car, so we isolate our attention to just the row of 150 red car owners and see how many have had a speeding ticket in the last year. Looking at the table, we see that there were 15 red car owners who had a speeding ticket in the last year, so we calculate:
\begin{gather*}
P(\text{speeding ticket given red car})=\frac{15}{150} = 0.10\text{ or } 10\%
\end{gather*}
Speeding Ticket
No Speeding Ticket
Total
Red Car
15
135
150
Not Red Car
45
470
515
Total
60
605
665
This question is also asking for a conditional probability, \(P(\text{red car given speeding ticket})\text{,}\) but it is phrased more like we would say it. In this case the given characteristic is that the person has received a speeding ticket, so we will isolate our attention to just the speeding ticket column. Among the 60 people who had a speeding ticket in the last year, we see that 15 also drove a red car. Now we can calculate the probability:
\begin{gather*}
P(\text{red car given speeding ticket})=\frac{15}{60} = 0.25\text{ or }25\%
\end{gather*}
Notice that compared with part e, when we change the conditional characteristic, we change the denominator of the fraction.
In part b, we determined that there was a 9% chance of randomly selecting a participant who had received a speeding ticket in the last year. However, in part e we found that there was a 25% chance of receiving a ticket in the last year if the person had a red car. This seems to suggest that there is a higher likelihood of getting a speeding ticket if you own a red car. This means that getting a speeding ticket is dependent on whether the person drives a red car, since that increases the probability of getting a ticket. We cannot say, however, whether driving a red car makes you speed or whether people who tend to drive faster buy red cars.
Subsection4.1.9Conditional Probabilities
We have mentioned conditional probabilities, which we find by isolating our attention to the given row or column. Here is another example of finding conditional probabilities.
Example4.1.4.
A home pregnancy test was given to a sample of 93 cisgender women, and their pregnancy was then verified by a blood test. The contingency table below shows the home pregnancy test and whether or not they were actually pregnant as determined by the blood test. Find the probability that a randomly selected woman in the sample
was not pregnant given the home test was positive.
had a positive home pregnancy test given they were not pregnant.
Positive Test
Negative Test
Total
Pregnant
70
4
74
Not Pregnant
5
14
19
Total
75
18
93
Solution.
Here are the solutions:
Since we are given the home test result was positive, we are limited to the 75 women in the positive test column, of which 5 were not pregnant. This gives:
Positive Test
Negative Test
Total
Pregnant
70
4
74
Not Pregnant
5
14
19
Total
75
18
93
\begin{gather*}
P(\text{not pregnant given positve test})=\frac{5}{75} \approx 0.067\text{ or } 6.7\%
\end{gather*}
Since we are given the woman is not pregnant, we are limited to the 19 women in the not pregnant row, of which 5 had a positive test. This gives:
Positive Test
Negative Test
Total
Pregnant
70
4
74
Not Pregnant
5
14
19
Total
75
18
93
\begin{gather*}
P(\text{positive test given not pregnant})=\frac{5}{19} \approx 0.263\text{ or } 26.3\%
\end{gather*}
This result is referred to as a false positive: A positive test result when the woman is not actually pregnant.
In this section we have learned about empirical probability. In the next section we will discuss another kind of probability that you may be familiar with – theoretical probability.
Exercises4.1.10Exercises
1.
A recent survey asked a random sample of PCC students if they are currently experiencing food insecurity and if they are currently experiencing housing insecurity. Fill in the missing entries of the contingency table below.
Food Insecure
Not Food Insecure
Total
Housing Insecure
60
Not Housing Insecure
460
760
Total
680
2.
A recent survey asked a random sample of PCC students if they have purchased food from the cafeteria in the last week, and if they purchased their textbooks through the bookstore. Fill in the missing entries of the contingency table below.
Bookstore
No Bookstore
Total
Cafeteria
375
No Cafeteria
135
Total
630
850
3.
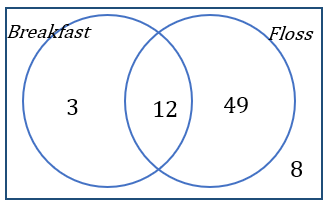
A recent survey asked PCC students if they regularly eat breakfast and if they regularly floss their teeth Use the completed Venn Diagram to fill in the corresponding contingency table.
Breakfast
No Breakfast
Total
Floss
No Floss
Total
4.
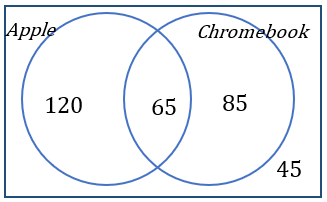
A recent survey asked PCC students if they used an Apple phone, and if the regularly used a Chromebook outside of school. Use the completed Venn Diagram to fill in the corresponding contingency table.
Chromebook
No Chromebook
Total
Apple
No Apple
Total
5.
Use the following information to complete the contingency table:
\(\displaystyle \text{P(A and B)} = 10/75\)
\(\displaystyle \text{P(A)} = 40/75 \)
\(\displaystyle \text{P(not B)} = 45/75\)
A
Not A
Total
B
Not B
Total
6.
Use the following information to complete the contingency table:
\(\displaystyle \text{P(A given B)} = 30/80\)
\(\displaystyle \text{P(Not A and Not B)} = 10/120\)
A
Not A
Total
B
Not B
Total
7.
A professor gave a test to students in a morning class and the same test to the afternoon class. The grades are summarized below.
A
B
C
Total
Morning Class
8
18
13
39
Afternoon Class
10
4
12
26
Total
18
22
25
65
If one student was chosen at random:
What is the probability they were in the morning class?
What is the probability they earned a C?
What is the probability that they earned an A and they were in the afternoon class?
What is the probability that they earned an A given they were in the morning class?
What is the probability that they were in the morning class or they earned a B?
8.
A professor surveyed students in her morning and afternoon Math 105 class, and asked what their class standing was. The class standings are summarized below:
Freshman
Sophomore
Junior
Senor
Total
Morning Class
12
5
7
8
32
Afternoon Class
5
13
8
2
28
Total
17
18
15
10
60
If one student was chosen at random:
What is the probability they were in the morning class?
What is the probability they were a Freshman?
What is the probability that they were a Senior and they were in the afternoon class?
What is the probability that they were a Sophomore given they were in the morning class?
What is the probability that they were in the morning class or they were a Junior?
9.
The contingency table below shows the number of credit cards owned by a group of individuals below the age of 35 and above the age of 35.
Zero
One
Two or more
Total
Between the ages of 18-35
9
5
19
33
Over age 35
18
10
20
48
Total
27
15
39
81
If one person was chosen at random:
What is the probability they had no credit cards?
What is the probability they had one credit card?
What is the probability they had no credit cards and is over 35?
What is the probability they are between the ages of 18 and 35, or have zero credit cards?
What is the probability they had no credit cards given that they are between the ages of 18 and 35?
What is the probability they have no credit cards given that they are over age 35?
Does it appear that having no credit cards depends on age? Or are they independent? Use probability to support your claim.
10.
The following contingency table provides data from a sample of 6,224 individuals who were exposed to smallpox in Boston. 2
Data taken from Mostly Harmless Probability & Statistics by Rachel Webb
Inoculated
Not Inoculated
Total
Lived
238
5136
5374
Died
6
844
850
Total
244
5980
6224
What is the probability that a person was inoculated?
What is the probability that a person lived?
What is the probability that a person died or was inoculated?
What is the probability that a person died given they were inoculated?
What is the probability that a person died given they were not inoculated?
Does it appear that survival depended on if a person were inoculated? Or are they independent? Use probability to support your claim.
11.
The contingency table below shows the survival data for the passengers of the Titanic.
First
Second
Third
Crew
Total
Survive
203
118
178
212
711
Not Survive
122
167
528
673
1490
Total
325
285
706
885
2201
What is the probability that a passenger did not survive?
What is the probability that a passenger was crew?
What is the probability that a passenger was first class and did not survive?
What is the probability that a passenger did not survive or was crew?
What is the probability that a passenger survived given they were first class?
What is the probability that a passenger survived given they were second class?
What is the probability that a passenger survived given they were third class?
Does it appear that survival depended on the passenger’s class? Or are they independent? Use probability to support your claim.
12.
The following table shows the utility patents granted for a specific year.
Corporation
Government
Individual
Total
United States
45%
2%
8%
55%
Foreign
41%
1%
3%
45%
Total
86%
11%
3%
100%
What is the probability that a patent is foreign and from the government?
What is the probability that a patent is from the U.S. and from a corporation?
What is the probability that a patent is foreign or from the government?
What is the probability that a patent is from the U.S. given it is from an individual?
What is the probability that a patent is foreign given it is from the government?
13.
There is a 15% chance that a shopper entering a computer store will purchase a computer, a 25% chance they will purchase a game/software, and there is a 10% chance they will purchase both a computer and a game/software.
Create a contingency table for the information.
Game/Software
No Game/Software
Total
Computer
No Computer
Total
What is the probability that a shopper will not purchase a computer and will not purchase a game/software?
What is the probability that a shopper will purchase a computer or purchase a game/software?
What is the probability that a shopper will purchase a game/software given they have purchased a computer?
What is the probability that a shopper will purchase a game/software given they did not purchase a computer?
Does it appear that purchasing a game/software depends on whether the shopper purchased a computer? Or are they independent? Use probability to support your claim.
14.
A fitness center coach kept track over the last year of whether members stretched before they exercised, and whether or not they sustained an injury. Among the 400 members, 322 stretched before they exercised, 327 did not sustain an injury, and 270 both stretched and did not sustain an injury.
Create a contingency table for the information.
Injury
No Injury
Total
Stretched
Not Stretched
Total
What is the probability that a member sustained an injury?
What is the probability that a member sustained an injury and did not stretch?
What is the probability that a member stretched or did not sustain an injury?
What is the probability that a member sustained an injury given they stretched?
What is the probability that a member sustained an injury given they did not stretch?
Does it appear that sustaining an injury depends on whether the member stretches before exercising? Or are they independent? Use probability to support your claim.
15.
Among the 95 books on a bookshelf, 72 are fiction, 28 are hardcover, and 87 are fiction or hardcover.
Create a contingency table for the information.
Hardcover
Paperback
Total
Fiction
Nonfiction
Total
What is the probability that a book is non-fiction and paperback?
What is the probability that a book is fiction given it is hardcover?
16.
After finishing the course, among the 32 students in a Math 105 class, 25 could successfully construct a contingency table, 27 passed the class, and 29 could successfully construct a contingency table or passed the class.
Create a contingency table for the information.
Contingency Table
No Contingency Table
Total
Pass
No Pass
Total
What is the probability that a student passed and could not successfully construct a contingency table?
What is the probability that a student passed given they could not successfully construct a contingency table?