Define and identify the population, parameter, sample and statistic
Identify four sampling methods: simple random sample (SRS), stratified, systematic and convenience
Identify and discuss types of bias association with sampling
Distinguish between experimental and observational studies
Explain margin of error and confidence intervals
Introduction to Statistics.
Figure3.1.1.Alternative Video Lessons
We are bombarded by information and statistics every day. But if we cannot distinguish credible information from misleading information, then we are vulnerable to manipulation and making decisions that are not in our best interest. Statistics provides tools for us to evaluate information critically. In this sense, statistics is one of the most important things to know about.
Statistics are often presented to add credibility to an argument. To give some examples, here are some claims that we have heard on several occasions. (We are not saying that each one of these claims is true!)
4 out of 5 dentists recommend Dentyne.
Almost 85% of lung cancers in men and 45% in women are tobacco-related.
Condoms are effective 94% of the time.
People tend to be more persuasive when they look others directly in the eye and speak loudly and quickly.
Women make 75 cents to every dollar a man makes when they work the same job.
A surprising new study shows that eating egg whites can increase one’s life span.
People predict that it is very unlikely there will ever be another baseball player with a batting average over 400.
There is an 80% chance that in a room full of 30 people that at least two people will share the same birthday.
79.48% of all statistics are made up on the spot.
All these claims are statistical in character. We suspect that some of them sound familiar; if not, you have probably heard other claims like them. Notice how diverse the examples are; they come from psychology, health, law, sports, business, etc. Data and data-interpretation show up in virtually every facet of contemporary life.
Many of these numbers do not represent careful statistical analysis. They can be misleading and push you into decisions that you might regret. This chapter will help you learn the skills to be a critical consumer of statistical claims.
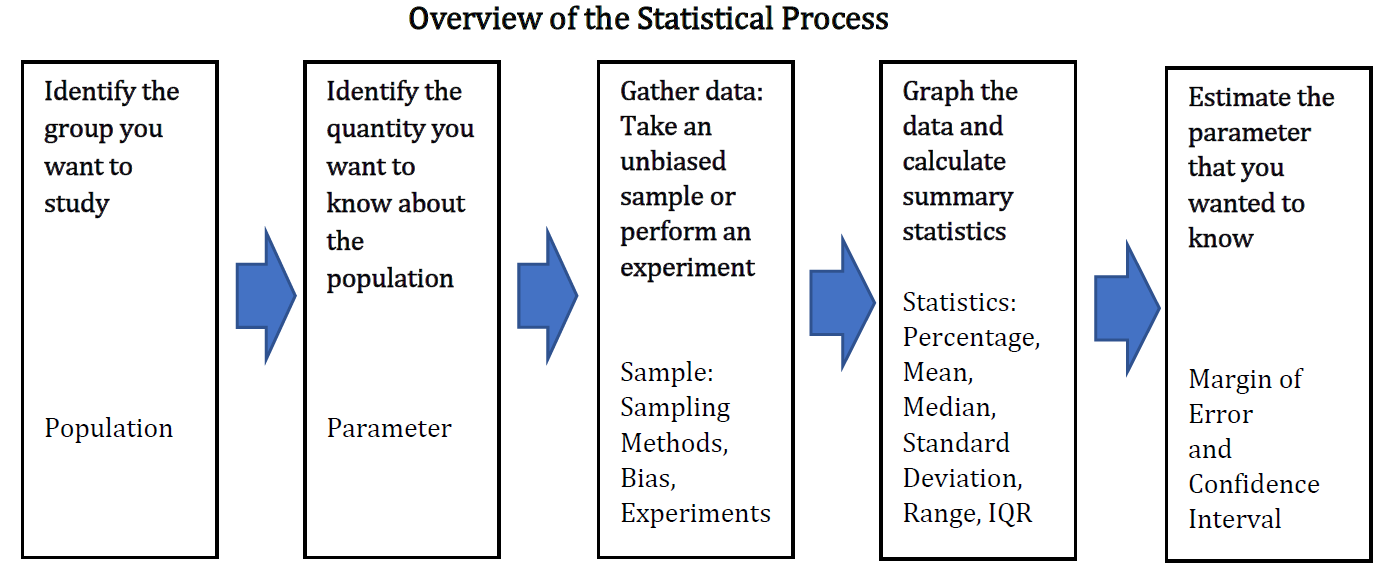
Subsection3.1.1Statistical Process
To give you an overview, here is a diagram of the steps taken in a poll or other statistical study, and the elements in each step that we will discuss in this chapter. We will use many examples to illustrate the whole process.
Subsection3.1.2Population
Before we begin gathering any data to analyze, we need to identify the population we are studying. The population of a study is the group we want to know something about. The population could be people, auto parts or tomato plants.
If we want to know the amount of money spent on textbooks by a typical college student, our population might be all students at Portland Community College. Or it might be:
All community college students in the state of Oregon.
All students at public colleges and universities in the state of Oregon.
All students at all colleges and universities in the state of Oregon.
All students at all colleges and universities in the entire United States.
And so on.
The intended population is also called the target population, since if we design our study badly, the collected data might not actually be representative of the intended population.
Example3.1.2.
A newspaper website contains a poll asking people their opinion on a recent news article. What is the population?
Solution.
While the target (intended) population may have been all people, the real population of the survey is readers of the website.
Subsection3.1.3Parameter
A parameter is the value (percentage, average, etc.) that we are interested in for the whole population. Since it is often too time-consuming, expensive and/or impossible to get data for the entire population, the parameter is usually a theoretical quantity that we are trying to estimate. For example, the typical amount of money spent per year on textbooks by students at your college in a year is a parameter.
Subsection3.1.4Sample
To estimate the parameter, we select a sample, which is a smaller subset of the entire population. It is very important that we choose a representative sample, one that matches the characteristics of the population, to have a good estimate. If we survey 100 students at your college, those students would be our sample. We will talk about how to choose a representative sample later in this section.
Subsection3.1.5Statistic
To get our data, we would then ask each student in the sample how much they spent on textbooks and record the answers, or raw data. Then we could calculate the average, which is our statistic. A statistic is a value (percentage, average, etc.) calculated using data from a sample.
Example3.1.3.
A researcher wants to know how the citizens of Portland feel about a voter initiative. To study this, they go downtown to the Pioneer Place Mall and survey 500 shoppers. Sixty percent indicate they are supportive of the initiative. Identify the population, parameter, sample and statistic.
Solution.
Population: While the intended population of this survey is Portland citizens, the effective population is Pioneer Place Mall shoppers. There is no reason to assume that shoppers at this mall would be representative of all Portland citizens.
Parameter: The parameter is what we want to know about the population, the percentage of Portland citizens that support the initiative.
Sample: The sample is the subgroup of the population selected. The 500 shoppers questioned make up the sample, which, again, is probably not representative of the population.
Statistic: The statistic is calculated using the data from the sample. The percentage of people sampled who support the initiative is 60%.
Subsection3.1.6Sampling
As we mentioned in a previous section, the first thing we should do before conducting a survey is to identify the population that we want to study. Suppose we are hired by a politician to determine the amount of support they have among the electorate should they decide to run for another term. What population should we study? Every person in the district? Eligible voters might be better, but what if they don’t register? Registered voters may not vote. What about “likely voters?”
This is the criteria used in a lot of political polling, but it is sometimes difficult to define a “likely voter.” Here is an example of the challenges of political polling.
Example3.1.4.
In November 1998, former professional wrestler Jesse "The Body" Ventura was elected governor of Minnesota. Up until right before the election, most polls showed he had little chance of winning. There were several contributing factors to the polls not reflecting the actual intent of the electorate:
Ventura was running on a third-party ticket and most polling methods are better suited to a two-candidate race.
Many respondents to polls may have been embarrassed to tell pollsters that they were planning to vote for a professional wrestler.
The mere fact that the polls showed Ventura had little chance of winning might have prompted some people to vote for him in protest to send a message to the major-party candidates.
But one of the major contributing factors was that Ventura recruited a substantial amount of support from young people, particularly college students, who had never voted before and who registered specifically to vote in that election. The polls did not deem these young people likely voters (since in most cases young people have a lower rate of voter registration and a lower turnout rate for elections) so the polling samples were subject to sampling bias: they omitted a portion of the electorate that was weighted in favor of the winning candidate.
So, identifying the population can be a difficult job, but once we have identified the population, how do we choose a good sample? We want our statistic to estimate the parameter we are interested in, so we need to have a representative sample. Returning to our hypothetical job as a political pollster, we would not anticipate very accurate results if we drew all of our samples from customers at a Starbucks, or your list of TikTok followers. How do we get a sample that resembles our population?
Subsection3.1.7Sampling Methods
One way to get a representative sample is to use randomness. We will look at three types of sampling that use randomness and one that does not.
Subsection3.1.8Simple random sample (SRS)
A simple random sample, abbreviated SRS, is one in which every member of the population has an equal probability of being chosen.
Example3.1.5.
If we could somehow identify all likely voters in the state, put each of their names on a piece of paper, toss the slips into a (very large) hat and draw 1000 slips out of the hat, we would have a simple random sample.
In practice, computers are better suited for this sort of endeavor. It is always possible, however, that even a random sample might end up not being totally representative of the population. If we repeatedly take samples of 1000 people from among the population of likely voters in the state of Oregon, some of these samples might tend to have a slightly higher percentage of Democrats (or Republicans) than the general population; some samples might include more older people and some samples might include more younger people; etc. This is called sampling variation. If there are certain groups that we want to make sure are represented, we might instead use a stratified sample.
Subsection3.1.9Stratified sampling
In stratified sampling, a population is divided into a number of subgroups (or strata). Random samples are then taken from each subgroup. It is often desirable to make the sample sizes proportional to the size of each subgroup in the population.
Example3.1.6.
Suppose that data from voter registrations in the state indicated that the electorate was comprised of 39% Democrats, 37% Republicans and 24% Independents. In a sample of 1000 people, they would then expect to get about 390 Democrats, 370 Republicans and 240 Independents. To accomplish this, they could randomly select 390 people from among those voters known to be Democrats, 370 from those known to be Republicans, and 240 from those with no party affiliation.
A way to remember stratified sampling is think about having a piece of layer cake. Each layer represents a stratum or subgroup, and a slice of the cake represents a sample of each layer.
Subsection3.1.10Systematic sampling
In systematic sampling, every \(n^{\text{th}}\) member of the population is selected to be in the sample. The starting position is often chosen at random.
Example3.1.7.
To select a systematic sample, Portland Community College could use their database to select a random student from the first 100 student ID numbers. Then they would select every 100th student ID number after that. Systematic sampling is not as random as a simple random sample (if your ID number is right next to your friend’s because you applied at the same time, you could not both end up in the same sample) but it can yield acceptable samples. This method can be useful for people waiting in lines, parts on a manufacturing line, or plants in a row.
Subsection3.1.11Convenience sampling
Convenience sampling is when samples are chosen by selecting whomever is convenient. This is the worst type of sampling because it does not use randomness.
Example3.1.8.
A pollster stands on a street corner and interviews the first 100 people who agree to speak to them. This is a convenience sample.
Subsection3.1.12Statistical Bias
There is no way to correct for biased data, so it is very important to think through the entire study and data analysis before we start. We talked about sampling or selection bias, which is when the sample is not representative of the population. One example of this is voluntary response bias, which is bias introduced by only collecting data from those who volunteer to participate. This can lead to bias if the people who volunteer have different characteristics than the general population. Here is a summary of some additional sources of bias.
Subsection3.1.13Types of bias
Sampling bias – when the sample is not representative of the population
Voluntary response bias – the sampling bias that often occurs when the sample is made up of volunteers
Self-interest study – bias that can occur when the researchers have an interest in the outcome
Response bias – when the responder gives inaccurate responses for any reason
Perceived lack of anonymity – when the responder fears giving an honest answer might negatively affect them
Loaded questions – when the question wording influences the responses
Non-response bias – when people refuse to participate in a study or drop out of an experiment, we can no longer be certain that our sample is representative of the population
Sources of bias may be conscious or unconscious. They may be innocent or as intentional as pressuring by a pollster. Here are some examples of the types of bias.
Example3.1.9.
Consider a recent study which found that chewing gum may raise math grades in teenagers 1
. This study was conducted by the Wrigley Science Institute, a branch of the Wrigley chewing gum company. This is an example of a self-interest study; one in which the researches have a vested interest in the outcome of the study. While this does not necessarily mean the study was biased, we should subject the study to extra scrutiny.
Consider online reviews of products and businesses. Customers tend to leave reviews if they are very satisfied or very dissatisfied. While you can look for overall patterns and get useful information, these reviews suffer from voluntary response bias and likely capture more extreme views than the general population.
A survey asks participants a question about their interactions with people of different ethnicities. This study could suffer from response bias. A respondent might give an untruthful answer to not be perceived as racist.
An employer puts out a survey asking their employees if they have a drug abuse problem and need treatment help. Here, answering truthfully might have serious consequences; responses might not be accurate if there is a perceived lack of anonymity and employees fear retribution.
A survey asks, “Do you support funding research on alternative energy sources to reduce our reliance on high-polluting fossil fuels?” This is an example of a loaded or leading question – questions whose wording leads the respondent towards a certain answer.
A poll was conducted by phone with the question, “Do you often have time to relax and read a book?” Fifty percent of the people who were called refused to participate in the survey (Probably because they didn’t have the time). It is unlikely that the results will be representative of the entire population. This is an example of non-response bias.
Loaded questions can occur intentionally by pollsters with an agenda, or accidentally through poor question wording. Also of concern is question order, where the order of questions changes the results. Here is an example from a psychology researcher 2
“My favorite finding is this: we did a study where we asked students, ’How satisfied are you with your life? How often do you have a date?’ The two answers were not statistically related - you would conclude that there is no relationship between dating frequency and life satisfaction. But when we reversed the order and asked, ’How often do you have a date? How satisfied are you with your life?’ the statistical relationship was a strong one. You would now conclude that there is nothing as important in a student’s life as dating frequency.”
Subsection3.1.14Observational Studies
So far, we have primarily discussed surveys and polls, which are types of observational studies – studies based on observations or measurements. These observations may be solicited, like in a survey or poll. Or, they may be unsolicited, such as studying the percentage of cars that turn right at a red light even when there is a “no turn on red” sign.
Subsection3.1.15Experiments
In contrast, it is common to use experiments when exploring how subjects react to an outside influence. In an experiment, some kind of treatment is applied to the subjects and the results are measured and recorded. When conducting experiments, it is essential to isolate the treatment being tested. Here are some examples of treatments.
Example3.1.11.
A pharmaceutical company tests a new medicine for treating Alzheimer’s disease by administering the drug to 50 elderly patients with recent diagnoses. The treatment here is the new drug.
A gym tests out a new weight loss program by enlisting 30 volunteers to try out the program. The treatment here is the new program.
A psychology researcher explores the effect of music on affect by measuring people’s mood while listening to different types of music. The music is the treatment.
Suppose a middle school finds that their students are not scoring well on the state’s standardized math test. They decide to run an experiment to see if a new curriculum would improve scores. To run the test, they hire a math specialist to come in and teach a class using the new curriculum. To their delight, they see an improvement in test scores.
The difficulty with the last scenario is that it is not clear whether the new curriculum or the math specialist is responsible for the improvement. This is called confounding and it is the downfall of many experiments, though it is often hidden.
Subsection3.1.16Confounding
Confounding occurs when there are two or more potential variables that could have caused the outcome and it is not possible to determine which one actually caused the result.
Example3.1.12.
A drug company study about a weight loss pill might report that people lost an average of 8 pounds while using their new drug. However, in the fine print you find a statement saying that participants were encouraged to also diet and exercise. It is not clear in this case whether the weight loss is due to the pill, to diet and exercise, or a combination of both. In this case confounding has occurred.
Researchers conduct an experiment to determine whether students will perform better on an arithmetic test if they listen to music during the test. They first give the student a test without music, then give a similar test while the student listens to music. In this case, the student might perform better on the second test, regardless of the music, simply because it was the second test and they were warmed up.
There are a number of measures that can be introduced to help reduce the likelihood of confounding. The primary measure is to use a control group.
Subsection3.1.17Control group
In experiments, the participants are typically divided into a treatment group and a control group. The treatment group receives the treatment being tested; the control group does not receive the treatment.
Ideally, the groups are otherwise as similar as possible, isolating the treatment as the only potential source of difference between the groups. For this reason, the method of dividing groups is important. Some researchers attempt to ensure that the groups have similar characteristics (same number of each gender identity, same number of people over 50, etc.), but it is nearly impossible to control for every characteristic. Because of this, random assignment is very commonly used.
Example3.1.13.
To determine if a two-day prep course would help high school students improve their scores on the SAT test, a group of students was randomly divided into two subgroups. The first group, the treatment group, was given a two-day prep course. The second group, the control group, was not given the prep course. Afterwards, both groups took the SAT test.
A company testing a new plant food grows two crops of plants in adjacent fields that typically produce the same amount of food. The treatment group receives the new plant food and the control group does not. The crop yields would then be compared. By growing the two crops at the same time in similar fields, they are controlling for weather and other confounding factors.
Sometimes not giving the control group anything does not completely control for confounding variables. For example, suppose a medicine study is testing a new headache pill by giving the treatment group the pill and the control group nothing. If the treatment group showed improvement, we would not know whether it was due to the medicine, or a response to have something. This is called a placebo effect.
Subsection3.1.18Placebo effect
The placebo effect is when the effectiveness of a treatment is influenced by the patient’s perception of how effective they think the treatment will be, so a result might be seen even if the treatment is ineffectual.
Example3.1.14.
A study found that when doing painful dental tooth extractions, patients told they were receiving a strong painkiller while actually receiving a saltwater injection found as much pain relief as patients receiving a dose of morphine. 3
Levine JD, Gordon NC, Smith R, Fields HL. (1981) Analgesic responses to morphine and placebo in individuals with postoperative pain. Pain. 10:379-89.
To control for the placebo effect, a placebo, or dummy treatment, is often given to the control group. This way, both groups are truly identical except for the specific treatment given.
Subsection3.1.19Placebo and Placebo-controlled experiments
An experiment that gives the control group a placebo is called a placebo-controlled experiment.
Example3.1.15.
In a study for a new medicine that is dispensed in a pill form, a sugar pill could be used as a placebo.
In a study on the effect of alcohol on memory, a non-alcoholic beer might be given to the control group as a placebo.
In a study of a frozen meal diet plan, the treatment group would receive the diet food, and the control group could be given standard frozen meals taken out of their original packaging.
In some cases, it is more appropriate to compare to a conventional treatment than a placebo. For example, in a cancer research study, it would not be ethical to deny any treatment to the control group or to give a placebo treatment. In this case, the currently acceptable medicine would be given to the second group, called a comparison group. In our SAT test example, the non-treatment group would most likely be encouraged to study on their own, rather than be asked to not study at all, to provide a meaningful comparison. It is very important to consider the ethical ramifications of any experiment.
Subsection3.1.20Blind studies
A blind study is one that uses a placebo and the participants do not know whether they are receiving the treatment or a placebo. A double-blind study is one in which the subjects and those interacting with them don’t know who is in the treatment group and who is in the control group.
Example3.1.16.
In a study about anti-depression medication, you would not want the psychological evaluator to know whether a patient is in the treatment or control group, as it might influence their evaluation. The experiment should be conducted as a double-blind study.
Subsection3.1.21Margin of Error and Confidence Intervals
Even when a study or experiment has successfully avoided bias and has been well done, there is still an element of variation. If we took 5 different random samples of 100 college students and calculated their average textbook cost, we wouldn’t expect to get the exact same average for each sample. This is due to sampling variation. To account for this, researchers publish their margin of error or a confidence interval for their statistics. These numbers describe the precision of the estimate for a certain confidence level.
You’ve probably heard something like, “The candidate has 54 percent of the likely voters, plus or minus three percent.” The 3% is called the margin of error, so the true percentage is somewhere between 51% and 57%, with a certain level of confidence. To write this as a confidence interval, we place the numbers in parentheses from smallest to largest, separated by a comma: (51%, 57%).
The most common confidence level is 95%, which means if the poll was conducted repeatedly, and we made a confidence interval each time, we would expect the true percentage, or parameter, to fall within our confidence interval 95 out of 100 times. You can learn more on how to calculate the margin of error for different confidence levels in a statistics class.
Example3.1.17.
Let’s say we asked a random sample of 100 students at Portland Community College and found that they spent an average of $451.32 on books their first year, plus or minus $85.63. Write this as a confidence interval, assuming a 95% confidence level.
Solution.
If the margin of error was calculated to be plus or minus $85.63, then with a confidence level of 95% we could say that the average amount spent by the population is somewhere between $365.69 and $536.95.
These values are found by computing \(\$451.32 - \$85.63 = \$365.69\) and \(\$451.32 + \$85.63 = \$536.95\)
We could also write this as a confidence interval: ($365.69, $536.95).
Now we have come full circle and seen how we can use data from a sample to estimate the parameter we were interested in for our population.
Exercises3.1.22Exercises
1.
Describe the difference between a sample and a population.
2.
Describe the difference between a statistic and a parameter.
3.
The ASPCC randomly selects 200 students from PCC Cascade campus to participate in a childcare survey in order to determine the demand for additional childcare options for PCC students.
Who is the intended population?
What is the sample?
Is the collected data representative of the intended population? Why or why not?
4.
A local research firm randomly selects 1200 homes in Washington County to determine support for adding compost pick up to residents’ regular garbage service.
Who is the intended population?
What is the sample?
Is the collected data representative of the intended population? Why or why not?
5.
A political scientist surveys 28 of the current 106 representatives in a state’s congress. Of them, 14 said they were supporting a new education bill, 12 said there were not supporting the bill, and 2 were undecided.
Who is the population of this survey?
What is the size of the population?
What is the size of the sample?
Give the statistic for the percentage of representatives surveyed who said they were supporting the education bill.
If the margin of error was 5%, give the confidence interval for the percentage of representatives we might we expect to support the education bill and explain what the confidence interval tells us.
6.
The city of Raleigh has 9,500 registered voters. There are two candidates for city council in an upcoming election: Brown and Feliz. The day before the election, a telephone poll of 350 randomly selected registered voters was conducted. 112 said they’d vote for Brown, 207 said they’d vote for Feliz, and 31 were undecided.
Who is the population of this survey?
What is the size of the population?
What is the size of the sample?
Give the statistic for the percentage of voters surveyed who said they’d vote for Brown.
If the margin of error was 3.5%, give the confidence interval for the percentage of voters surveyed that we might we expect to vote for Brown and explain what the confidence interval tells us.
7.
To determine the average length of trout in a lake, researchers catch 20 fish and measure them. Describe the population and sample of this study.
8.
To determine the average diameter of evergreen trees in a forested park, researchers randomly tag 45 specimens and measure their diameter. Describe the population and sample of this study.
9.
A college reports that the average age of their students is 28 years old. Is this a parameter or a statistic?
10.
A local newspaper reports that among a sample of 250 subscribers, 45% are over the age of 50. Is this a parameter or a statistic?
11.
A recent survey reported that 64% of respondents were in favor of expanding the BIKETOWN bike share system to the greater Portland area. Is this a parameter or a statistic?
12.
Which sampling method is being described?
In a study, the sample is chosen by separating all cars by size and selecting 10 of each size grouping.
In a study, the sample is chosen by writing everyone’s name on a playing card, shuffling the deck, then choosing the top 20 cards.
Every 4th person on the class roster was selected.
13.
Which sampling method is being described?
A sample was selected to contain 25 people aged 18-34 and 30 people aged 35-70.
Viewers of a new show are asked to respond to a poll on the show’s website.
To survey voters in a town, a polling company randomly selects 100 addresses from a database and interviews those residents.
14.
Identify the most relevant source of bias in each situation.
A survey asks the following: Should the mall prohibit loud and annoying rock music in clothing stores catering to teenagers?
To determine opinions on voter support for a downtown renovation project, a surveyor randomly questions people working in downtown businesses.
A survey asks people to report their actual income and the income they reported on their IRS tax form.
A survey randomly calls people from the phone book and asks them to answer a long series of questions.
The Beef Council releases a study stating that consuming red meat poses little cardiovascular risk.
A poll asks, “Do you support a new transportation tax, or would you prefer to see our public transportation system fall apart?”
15.
Identify the most relevant source of bias in each situation.
A survey asks the following: Should the death penalty be permitted if innocent people might die?
A study seeks to investigate whether a new pain medication is safe to market to the public. They test by randomly selecting 300 people who identify as men from a set of volunteers.
A survey asks how many sexual partners a person has had in the last year.
A radio station asks listeners to phone in their response to a daily poll.
A substitute teacher wants to know how students in the class did on their last test. The teacher asks the 10 students sitting in the front row to state their latest test score.
High school students are asked if they have consumed alcohol in the last two weeks.
16.
Identify whether each situation describes an observational study or an experiment.
The temperature on randomly selected days throughout the year was measured.
One group of students listened to music and another group did not while they took a test and their scores were recorded.
The weights of 30 randomly selected people are measured.
17.
Identify whether each situation describes an observational study or an experiment.
Subjects are asked to do 20 jumping jacks, and then their heart rates are measured.
Twenty coffee drinkers and twenty tea drinkers are given a concentration test.
The weights of potato chip bags are weighed on the production line before they are put into boxes.
18.
A team of researchers is testing the effectiveness of a new vaccine for human papilloma virus (HPV). They randomly divide the subjects into two groups. Group 1 receives new HPV vaccine, and Group 2 receives the existing HPV vaccine. The patients in the study do not know which group they are in.
Which is the treatment group?
Which is the control group (if there is one)?
Is this study blind, double-blind, or neither?
Is this best described as an experiment, a controlled experiment, or a placebo-controlled experiment?
19.
Studies are often done by pharmaceutical companies to determine the effectiveness of a treatment. Suppose that a new cancer treatment is under study. Of interest is the average length of time in months patients live once starting the treatment. Two researchers each follow a different set of 40 cancer patients throughout this new treatment.
What is the population of this study?
Would you expect the data from the two researchers to be identical? Why or why not?
If the first researcher collected their data by randomly selecting 8 patients from each of 5 local hospitals, which sampling method did they use?
If the second researcher collected their data by choosing 40 patients they knew, what sampling method did they use? What concerns would you have about this data set, based upon the data collection method?
20.
For the clinical trials of a weight loss drug containing Garcinia Cambogia the subjects were randomly divided into two groups. The first received an inert pill along with an exercise and diet plan, while the second received the test medicine along with the same exercise and diet plan. The patients do not know which group they are in, nor do the fitness and nutrition advisors.
Which is the treatment group?
Which is the control group (if there is one)?
Is this study blind, double-blind, or neither?
Is this best described as an experiment, a controlled experiment, or a placebo-controlled experiment?
21.
A study is conducted to determine whether people learn better with routine or crammed studying. Subjects volunteer from an introductory psychology class. At the beginning of the semester 12 subjects volunteer and are assigned to the routine studying group. At the end of the semester 12 subjects volunteer and are assigned to the crammed studying group.
Identify the target population and the sample.
Is this an observational study or an experiment?
This study involves two kinds of non-random sampling: 1. Subjects are not randomly sampled from a specified population and 2. Subjects are not randomly assigned to groups. Which problem is more serious? What effect on the results does each have?
22.
To test a new lie detector, two groups of subjects are given the new test. One group is asked to answer all the questions truthfully. The second group is asked to tell the truth on the first half of the questions and lie on the second half. The person administering the lie detector test does not know what group each subject is in. Does this experiment have a control group? Is it blind, double-blind, or neither? Explain.
23.
A poll found that 30%, plus or minus 5% of college freshmen prefer morning classes to afternoon classes.
What is the margin of error?
Write the survey results as a confidence interval.
Explain what the confidence interval tells us about the percentage of college freshmen who prefer morning classes?
24.
A poll found that 38% of U.S. employees are engaged at work, plus or minus 3.5%.
What is the margin of error?
Write the survey results as a confidence interval.
Explain what the confidence interval tells us about the percentage of U.S. employees who are engaged at work?
25.
A recent study reported a confidence interval of (24%, 36%) for the percentage of U.S. adults who plan to purchase an electric car in the next 5 years.
What is the statistic from this study?
What is the margin of error?
26.
A recent study reported a confidence interval of (44%, 52%) for the percentage of two-year college students who are food insecure.
What is the statistic from this study?
What is the margin of error?
27.
A farmer believes that playing Barry Manilow songs to his peas will increase their yield. Describe a controlled experiment the farmer could use to test his theory.
28.
A sports psychologist believes that people are more likely to be extroverted as an adult if they played team sports as a child. Describe two possible studies to test this theory. Design one as an observational study and the other as an experiment. Which is more practical?
29.
Find a newspaper or magazine article, or the online equivalent, describing the results of a recent study (not a simple poll). Give a summary of the study’s findings, then analyze whether the article provided enough information to determine the validity of the conclusions. If not, produce a list of things that are missing from the article that would help you determine the validity of the study. Look for the things discussed in the text: population, sample, randomness, blind, control, margin of error, etc.
30.
Use a polling website such as pewresearch.com or gallup.com and search for a poll that interests you. Find the result, the margin of error and confidence level for the poll and write the confidence interval.